To make a custom preset view go to the Volume Rendering tab, then in the control panel select the Set Custom button. 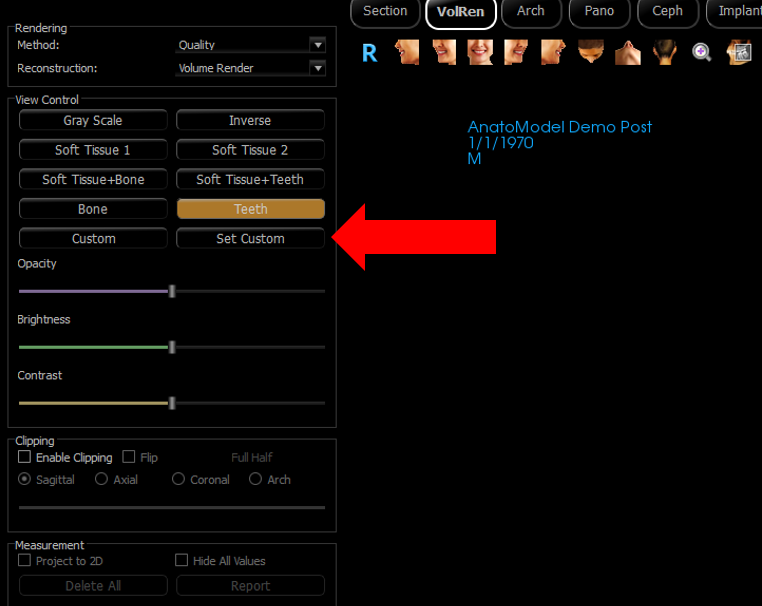
The Custom transfer Function Editor popup will display the configurations based on the selected preset. The image above has the Teeth preset selected, prior to selecting the Set Custom button.
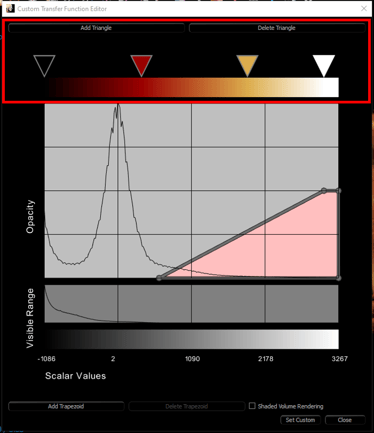
The Custom transfer Function Editor popup.
The Color Gradient Editor
This section allows you to modify the color gradient that is applied to a selected trapezoid. In this section users can add color triangles to refine the color gradient by selecting the Add Triangle button. By selecting the Delete Triangle button the user can remove color triangles which allows them to decrease the steps in the color gradient.
Selecting the color triangles and shifting them left or right allows the user to adjust the color range that is visible in the trapezoid.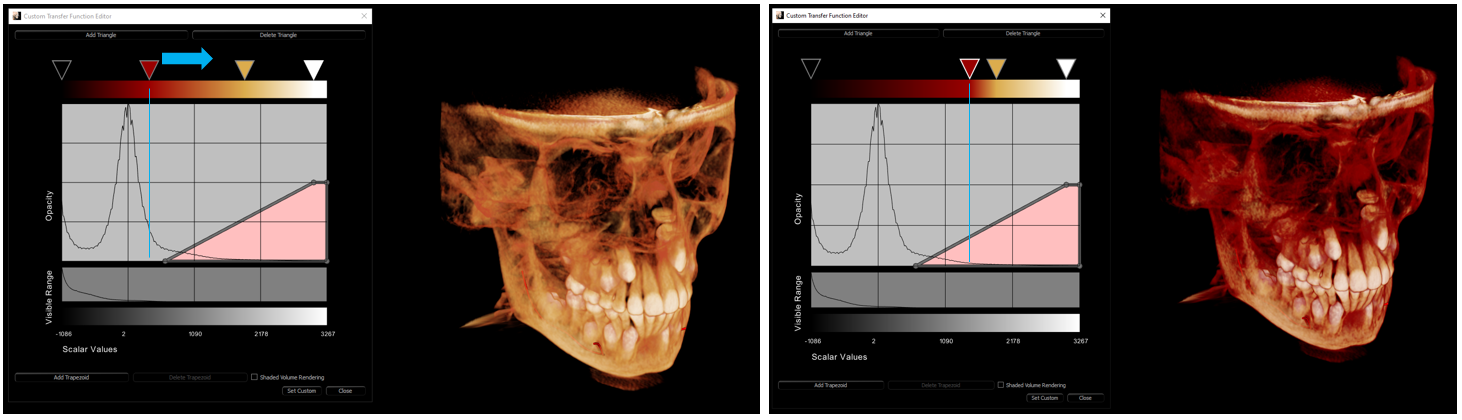
Double clicking on the Color Triangle displays the Color pallet which allows the user to change the individual colors in the Color Gradient. 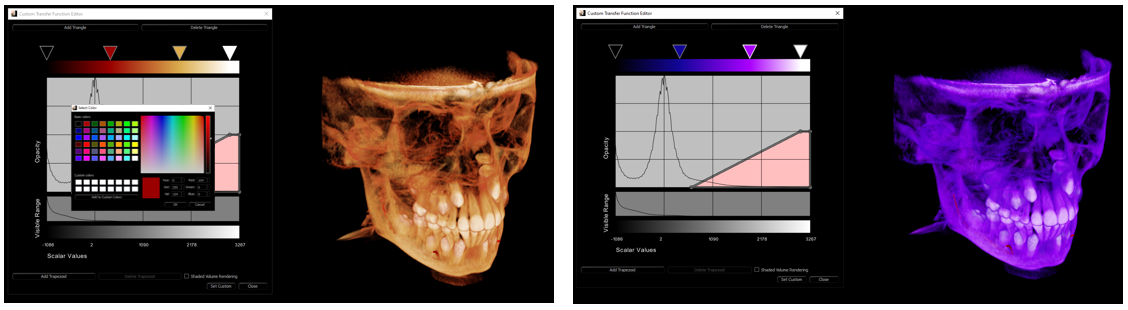
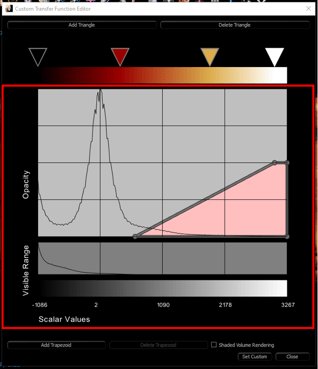
The Graph Section
The Hounsfield Histogram
The Hounsfield Histogram displays a histogram of all the hounsfield units in the study.
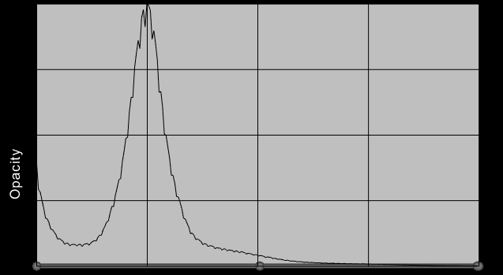
The Density Histogram
The Density Histogram corresponds the Hounsfield Histogram above it, and shows the users the density distribution of the study, least dense on the left to most dense on the right.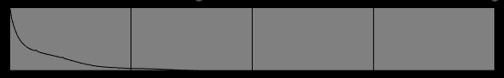
The Scalar Value Gradient Bar
The Scalar Value gradient bar corresponds to the Density and Hounsfield Histograms above it. The Scalar Value is the gray scale value of the voxel or Hounsfield unit.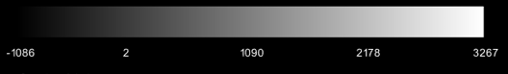
Creating a Custom View
Modifying an existing preset custom view
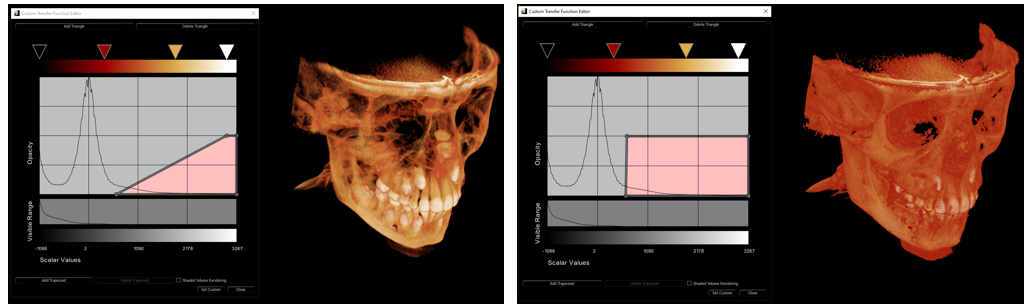
Users can select a preset view and modify it as they wish to make a custom view. Or they can delete all trapezoids in a preset view then select the Add Trapezoid button and create a completely new Custom View.
By left clicking on the bar or point and shifting it to the top or bottom of the Hounsfield Histogram the Volume rendering will become more or less transparent.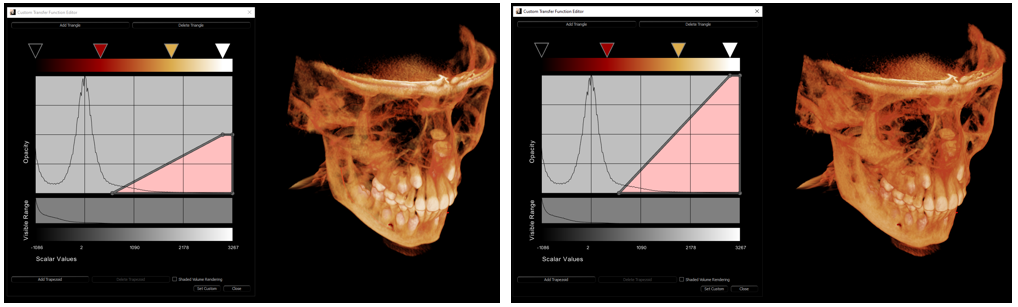
By left clicking on the bar or point and shifting it to the right or left of the Hounsfield Histogram will allow the user to capture more or less of the data in the study.
Once the user is happy with their Custom View, they must select the Set Custom button to save it as a custom preset.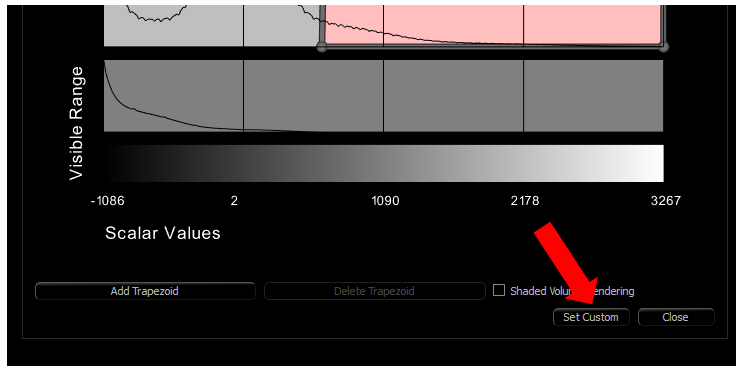
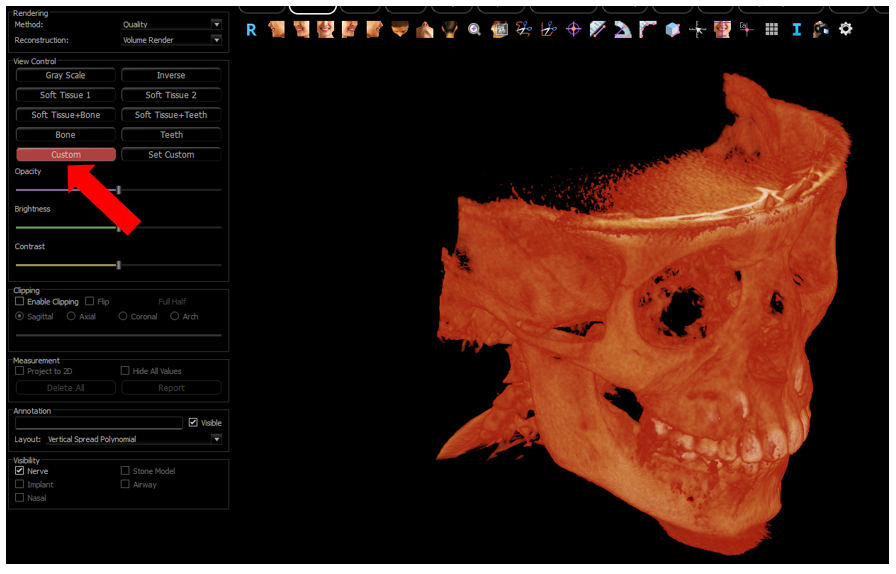
The user can then select the Custom button it the view control in the control panel to use their new custom view.